Unlocking Curiosity and Learning with KWL Charts: A Teacher’s Guide
In the ever-evolving landscape of education, teachers are constantly searching for tools that engage students, activate prior knowledge, and foster a deeper understanding of new concepts. One such tool, the KWL chart, has stood the test of time as a simple yet powerful strategy for guiding learning. Short for “What I Know, What I Want to Know, and What I Learned,” the KWL chart is a versatile graphic organizer that helps students organize their thoughts, set learning goals, and reflect on their progress. Whether you’re teaching science, history, literature, or math, KWL charts can be a valuable addition to your teaching toolkit.
This article explores what KWL charts are, how they can be used effectively in the classroom, where they work best, and where they might fall short. By the end, you’ll have a clear understanding of how to harness the power of KWL charts to inspire curiosity and enhance learning.
What Is a KWL Chart?
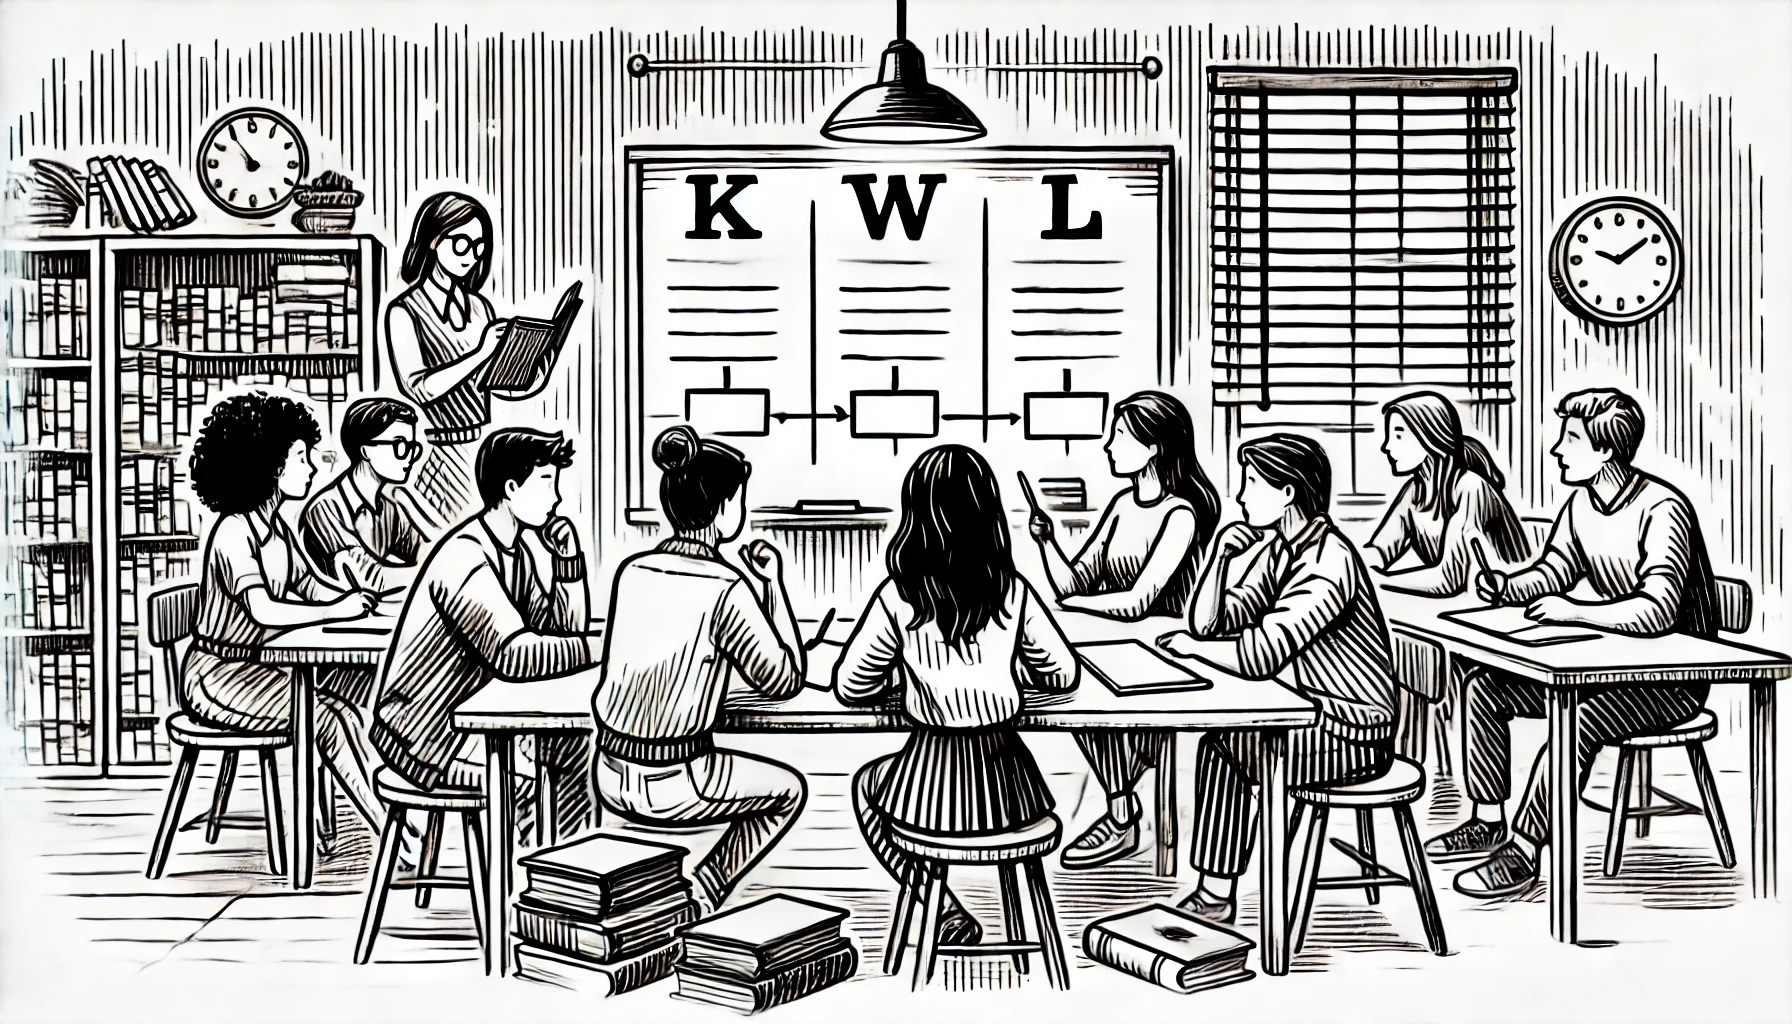
A KWL chart is a three-column graphic organizer that guides students through the learning process. Each column serves a specific purpose:
- K (What I Know): This column activates prior knowledge by asking students to list what they already know about a topic.
- W (What I Want to Know): This column encourages curiosity by prompting students to generate questions or identify what they hope to learn.
- L (What I Learned): This column provides space for students to reflect on and record what they’ve learned after completing a lesson or unit.
KWL charts can be used individually, in small groups, or as a whole-class activity. They are particularly effective for introducing new topics, guiding inquiry-based learning, and fostering metacognition.
How to Use KWL Charts in Teaching
KWL charts are incredibly versatile and can be adapted to suit a wide range of subjects, grade levels, and teaching styles. Here’s how to use them effectively:
1 - Introducing a New Topic
KWL charts are ideal for launching a new unit or lesson. They help students connect the topic to their existing knowledge and set a purpose for learning. For example:
- In a science class studying ecosystems, students might list what they know about food chains in the “K” column and ask questions like, “How do humans impact ecosystems?” in the “W” column.
- In a history class exploring the Civil Rights Movement, students might note key figures they’ve heard of in the “K” column and express curiosity about specific events in the “W” column.
2 - Guiding Inquiry-Based Learning
KWL charts are a natural fit for inquiry-based learning, where students take an active role in exploring questions and solving problems. The “W” column helps students formulate their own questions, driving curiosity and engagement. For example:
- In a math class, students might use the “W” column to brainstorm real-world applications of a new concept, such as “How is geometry used in architecture?”
- In a literature class, students might generate questions about a novel’s themes or characters, such as “Why did the protagonist make that decision?”
3 - Encouraging Reflection
The “L” column provides an opportunity for students to reflect on their learning and consolidate their understanding. This step is crucial for metacognition, as it helps students recognize how their knowledge has grown. For example:
- After a unit on climate change, students might fill in the “L” column with new insights, such as “I learned that deforestation contributes to global warming.”
- After reading a novel, students might note how their understanding of a character evolved, such as “I learned that the protagonist’s actions were motivated by fear.”
4 - Differentiating Instruction
KWL charts can be adapted to meet the needs of diverse learners. For example:
- Younger students or struggling learners might use pictures or simple phrases to complete their charts.
- Advanced learners might be encouraged to delve deeper by researching answers to their “W” questions or connecting their learning to broader themes.
5 - Promoting Collaboration
KWL charts can be used as a collaborative tool to foster discussion and teamwork. For example:
- Have small groups complete a shared KWL chart, encouraging students to build on each other’s ideas.
- Use a class-wide KWL chart to create a sense of shared learning and curiosity.
Where KWL Charts Work Best
KWL charts are particularly effective in certain contexts:
- Introductory Lessons: They excel at activating prior knowledge and setting the stage for new learning.
- Inquiry-Based Learning: They encourage students to ask questions and take ownership of their learning.
- Reflective Practice: They provide a structured way for students to reflect on their progress and consolidate their understanding.
- Cross-Curricular Applications: They can be used in virtually any subject, from science and math to literature and social studies.
Where KWL Charts Might Fall Short
While KWL charts are a valuable tool, they are not a one-size-fits-all solution. Here are some situations where they might be less effective:
- Highly Structured Curricula: In settings where the curriculum is tightly scripted, there may be less room for student-driven inquiry, limiting the effectiveness of the “W” column.
- Advanced or Specialized Topics: For highly complex or niche topics, students may struggle to generate meaningful questions in the “W” column due to a lack of prior knowledge.
- Overuse: If used too frequently or without variation, KWL charts can become repetitive and lose their impact.
Tips for Maximizing the Impact of KWL Charts
To get the most out of KWL charts, consider these tips:
- Model the Process: Demonstrate how to complete a KWL chart by thinking aloud and filling out a sample chart with the class.
- Encourage Depth: Push students to go beyond surface-level responses by asking follow-up questions or prompting them to elaborate.
- Integrate Technology: Use digital tools like interactive whiteboards or online KWL templates to make the process more engaging.
- Combine with Other Strategies: Pair KWL charts with other teaching strategies, such as concept maps, discussions, or hands-on activities, to enhance learning.
A Positive Approach: Fostering Curiosity and Growth
KWL charts are more than just a teaching tool; they are a way to foster curiosity, critical thinking, and a love of learning. By giving students a voice in their education and encouraging them to reflect on their progress, KWL charts empower learners to take ownership of their journey.
Final Thoughts: The Enduring Value of KWL Charts
In a world where education is increasingly focused on outcomes and assessments, KWL charts remind us of the importance of curiosity, reflection, and connection. They are a simple yet powerful way to engage students, activate prior knowledge, and celebrate learning.
So, whether you’re introducing a new topic, guiding an inquiry project, or wrapping up a unit, consider reaching for a KWL chart. It’s a small tool with the potential to make a big impact—one question, one insight, and one “aha” moment at a time. Here’s to unlocking the joy of learning with KWL charts!
22 de fevereiro, 2025
Jason F. Irwin |
|
| For nearly 20 years, I have been deeply involved in education—designing software, delivering lessons, and helping people achieve their goals. My work bridges technology and learning, creating tools that simplify complex concepts and make education more accessible. Whether developing intuitive software, guiding students through lessons, or mentoring individuals toward success, my passion lies in empowering others to grow. I believe that education should be practical, engaging, and built on a foundation of curiosity and critical thinking. Through my work, I strive to make learning more effective, meaningful, and accessible to all. |